EUR/GBP Elliott Wave technical analysis [Video]

EUR/GBP Elliott Wave technical analysis
-
Function: Bearish Trend.
-
Mode: Impulsive.
-
Structure: Orange wave 3.
-
Position: Navy blue wave 1.
-
Direction next higher degrees: Orange wave 4.
-
Details: Orange wave 2 appears to be completed, and now orange wave 3 is in progress.
-
Wave cancel invalidation level: 0.84737.
EUR/GBP day chart analysis overview
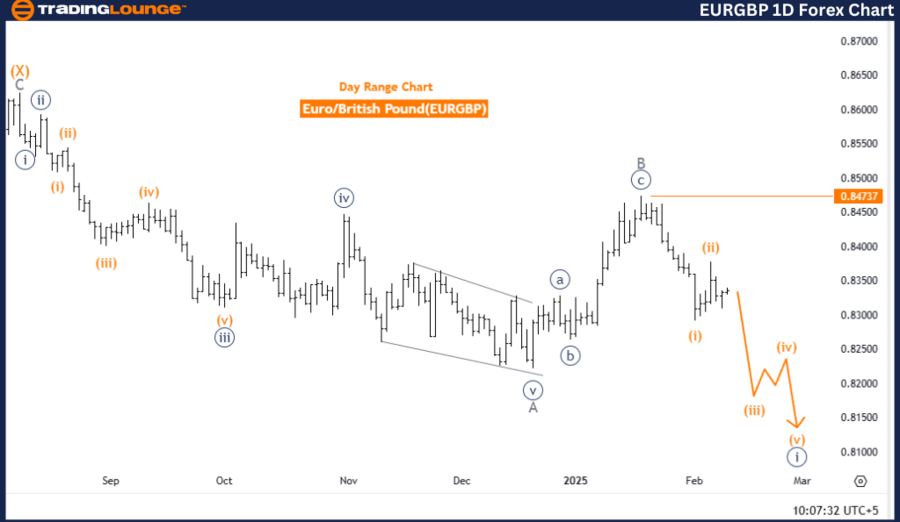
The EURGBP day chart analysis reflects a bearish trend, guided by Elliott Wave Theory and structured within an impulsive mode. The market is currently positioned in orange wave 3, a key stage of the downward cycle, often characterized by strong price declines and intensified selling pressure.
At this point, navy blue wave 1 is taking shape, indicating that the market is in the early stages of a long-term bearish cycle. With orange wave 2 now seemingly complete, the corrective phase has concluded, setting the stage for orange wave 3 to unfold. This phase is known for its aggressive movement and potential trading opportunities as downward momentum strengthens.
Bearish momentum and trading implications
As orange wave 3 continues to develop, bearish momentum is increasing. Traders should expect heightened price volatility and further downside movement. The invalidation level is set at 0.84737, meaning that if the price moves above this level, the existing wave analysis would be invalid, requiring a reassessment of market conditions.
This analysis highlights the importance of tracking price behavior throughout orange wave 3, as it represents a critical phase in the ongoing bearish trend. Traders are advised to remain alert for momentum indicators and key resistance levels that could impact future price action.
Conclusion
The EURGBP day chart suggests a bearish market outlook, with focus on the impulsive movement of orange wave 3 within navy blue wave 1. The completion of orange wave 2 reinforces the expectation of continued downward pressure, presenting potential trading opportunities.
Monitoring price action near the invalidation level (0.84737) is crucial to maintaining an accurate trading strategy and confirming the wave count’s validity.
EUR/GBP Elliott Wave technical analysis
-
Function: Bearish Trend.
-
Mode: Impulsive.
-
Structure: Orange wave 3.
-
Position: Navy blue wave 1.
-
Direction next higher degrees: Orange wave 4.
-
Details: Orange wave 2 appears to be completed, and now orange wave 3 is in progress.
-
Wave cancel invalidation level: 0.84737.
EUR/GBP four-hour chart analysis overview
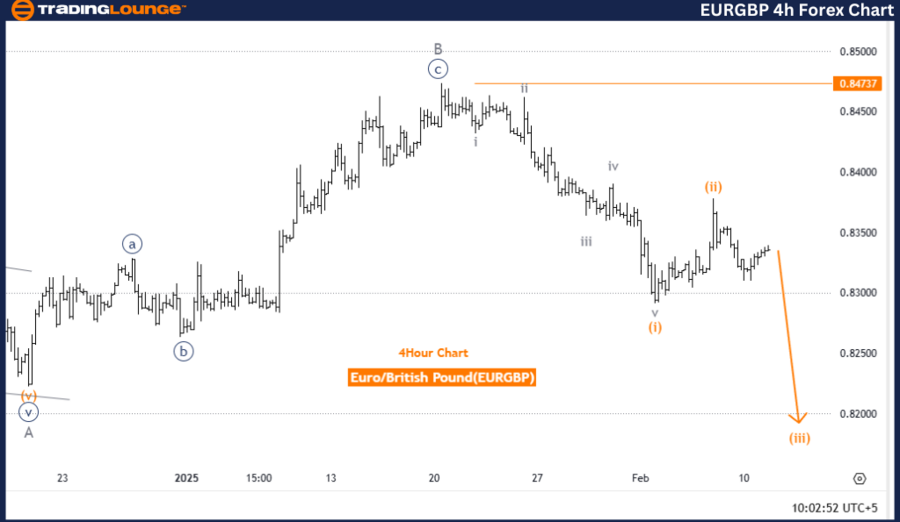
The EURGBP 4-hour chart reflects a bearish trend, structured under Elliott Wave Theory in an impulsive mode. The market is currently within orange wave 3, a phase typically associated with strong downward movement, increased selling pressure, and significant price declines.
At this stage, the position within navy blue wave 1 indicates that the market remains in the early phase of the bearish cycle. This suggests that further downside movement is likely as the next waves unfold. The completion of orange wave 2 reinforces the bearish sentiment, marking the transition from a corrective phase to a more aggressive downward trend.
Bearish momentum and trading implications
With orange wave 3 gaining traction, selling activity is intensifying, contributing to continued bearish momentum. Traders should stay alert for price action signals and momentum shifts, as this wave often presents key trading opportunities in a downtrending market.
The wave cancel invalidation level is set at 0.84737. If the price surpasses this level, the current wave count would be invalid, requiring a reassessment of the market structure. Therefore, tracking price movements around this threshold is essential for maintaining an accurate market outlook.
Conclusion
The EURGBP 4-hour chart confirms a bearish market scenario, driven by the development of orange wave 3 within navy blue wave 1. The completion of orange wave 2 signals a resumption of downward momentum, highlighting potential trading opportunities.
Close monitoring of price action near the invalidation level (0.84737) is critical to ensuring trading strategies remain aligned with the prevailing market trend.
EUR/GBP Elliott Wave technical analysis [Video]
The Foundation for the Study of Cycles welcomes all FXStreet members to have a look at our latest forex cycles research work! Please visit FXcyclestrader.com to register for free details.
Author

Peter Mathers
TradingLounge
Peter Mathers started actively trading in 1982. He began his career at Hoei and Shoin, a Japanese futures trading company.