EUR/GBP Elliott Wave technical analysis [Video]

EUR/GBP Elliott Wave technical analysis
-
Function: Bearish Trend.
-
Mode: Impulsive.
-
Structure: Orange Wave 3.
-
Position: Navy Blue Wave 1.
-
Direction (next higher degree): Orange Wave 4.
-
Wave invalidation level: 0.83572.
Analysis overview
The EURGBP Elliott Wave Analysis for the daily chart examines the Euro (EUR) against the British Pound (GBP), confirming a bearish trend. The market is currently in an impulsive phase, indicating strong momentum in the downward direction.
The current wave structure is identified as Orange Wave 3, which forms part of a larger Navy Blue Wave 1, signaling a significant downward movement.
Wave structure breakdown
-
Orange Wave 2 (a corrective phase within Navy Blue Wave 1) appears completed, leading to the development of Orange Wave 3.
-
Orange Wave 3 is expected to continue driving the price further downward.
-
The next higher-degree wave is Orange Wave 4, which implies that after Orange Wave 3 completes, a corrective phase may follow.
Key level to watch
-
Wave Cancellation Invalidation Level: 0.83572
-
This threshold is critical—if the price moves above 0.83572, the current wave count is invalidated, potentially altering the bearish outlook.
Traders should monitor this level closely to confirm the validity of the ongoing downtrend.
Conclusion
The EURGBP daily chart analysis suggests a bearish trend with strong impulsive momentum.
-
The market is currently in Orange Wave 3 within Navy Blue Wave 1, signaling further downside potential.
-
The completion of Orange Wave 2 has set the stage for continued downward movement.
-
The invalid level at 0.83572 acts as a crucial marker for the continuation or possible reversal of the bearish trend.
-
The next phase, Orange Wave 4, is expected to bring a corrective phase once Orange Wave 3 completes.
This Elliott Wave Analysis provides traders with a clear framework for understanding current market dynamics and future price movements.
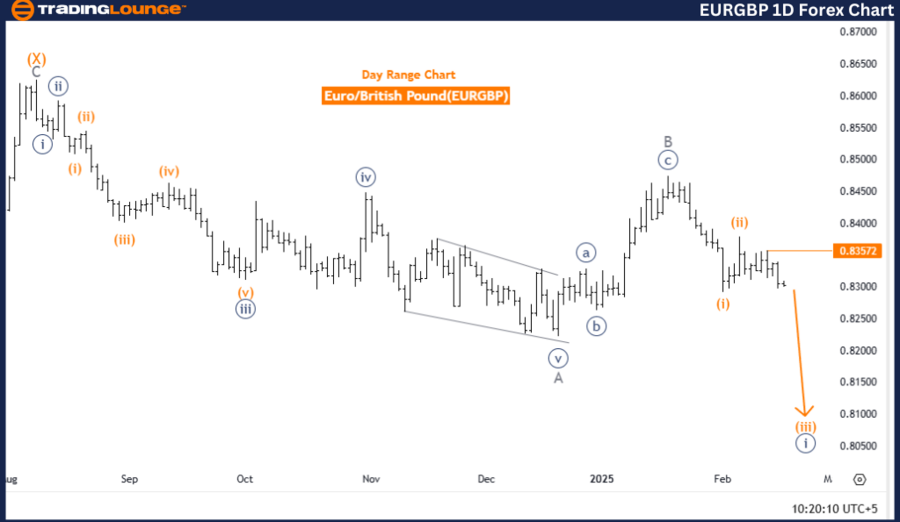
EUR/GBP daily chart
EUR/GBP Elliott Wave technical analysis
-
Function: Bearish Trend.
-
Mode: Impulsive.
-
Structure: Gray Wave 3.
-
Position: Orange Wave 3.
-
Direction (next higher degree): Gray Wave 3 (Started).
-
Wave invalidation level: 0.83572.
Analysis overview
The EURGBP Elliott Wave Analysis for the 4-hour chart examines the Euro (EUR) against the British Pound (GBP), confirming a bearish trend. The market remains in an impulsive phase, signaling strong downward momentum.
The wave structure is identified as Gray Wave 3, forming part of a larger Orange Wave 3, indicating a significant downward movement in progress.
Wave structure breakdown
-
Gray Wave 2, a corrective phase within Orange Wave 3, appears completed, leading to the development of Gray Wave 3.
-
Gray Wave 3 is expected to continue driving prices lower.
-
The next higher-degree wave is Gray Wave 3, confirming that bearish momentum is likely to persist in the near term.
Key level to watch
-
Wave Cancellation Invalidation Level: 0.83572.
-
This level is critical—if the price moves above 0.83572, the current wave count is invalidated, potentially altering the bearish outlook.
Traders should monitor this level closely to confirm the validity of the ongoing downtrend.
Conclusion
The EURGBP 4-hour chart analysis suggests a bearish trend with strong impulsive momentum.
-
The market is currently in Gray Wave 3 of Orange Wave 3, signaling further downside potential.
-
The completion of Gray Wave 2 has set the stage for continued downward movement.
-
The invalid level at 0.83572 acts as a crucial marker for the continuation or possible reversal of the bearish trend.
-
The next phase, Gray Wave 3, is expected to drive the price lower, reinforcing bearish sentiment in the market.
This Elliott Wave Analysis provides traders with a clear framework for understanding current market dynamics and future price movements.

EUR/GBP four-hour chart
EUR/GBP Elliott Wave technical analysis [Video]
The Foundation for the Study of Cycles welcomes all FXStreet members to have a look at our latest forex cycles research work! Please visit FXcyclestrader.com to register for free details.
Author

Peter Mathers
TradingLounge
Peter Mathers started actively trading in 1982. He began his career at Hoei and Shoin, a Japanese futures trading company.